RPKM_saturation.py
The precision of any sample statitics (RPKM) is affected by sample size (sequencing depth); 'resampling' or 'jackknifing' is a method to estimate the precision of sample statistics by using subsets of available data. This module will resample a series of subsets from total RNA reads and then calculate RPKM value using each subset. By doing this we are able to check if the current sequencing depth was saturated or not (or if the RPKM values were stable or not) in terms of genes' expression estimation. If sequencing depth was saturated, the estimated RPKM value will be stationary or reproducible. By default, this module will calculate 20 RPKM values (using 5%, 10%, ... , 95%,100% of total reads) for each transcripts.
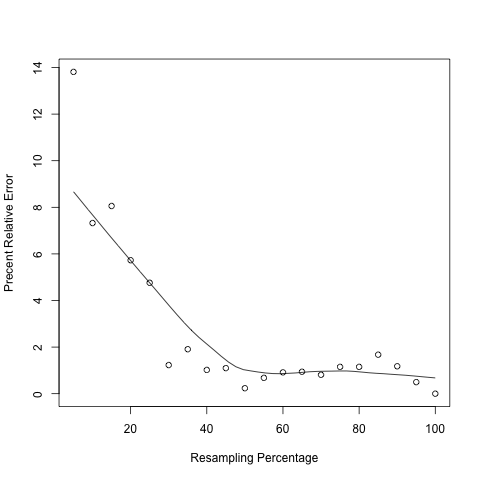
In the output figure, Y axis is "Percent Relative Error" or "Percent Error" which is used to measures how the RPKM estimated from subset of reads (i.e. RPKMobs) deviates from real expression level (i.e. RPKMreal). However, in practice one cannot know the RPKMreal. As a proxy, we use the RPKM estimated from total reads to approximate RPKMreal.

Inputs
- Input BAM/SAM file
- Alignment file in BAM/SAM format.
- Reference gene model
- Gene model in BED format.
- Strand sequencing type (default=none)
- See Infer Experiment tool if uncertain.
Options
- Skip Multiple Hit Reads
- Use Multiple hit reads or use only uniquely mapped reads.
- Only use exonic reads
- Renders program only used exonic (UTR exons and CDS exons) reads, otherwise use all reads.
Output
- output..eRPKM.xls: RPKM values for each transcript
- output.rawCount.xls: Raw count for each transcript
- output.saturation.r: R script to generate plot
- output.saturation.pdf:

- All transcripts were sorted in ascending order according to expression level (RPKM). Then they are divided into 4 groups:
- Q1 (0-25%): Transcripts with expression level ranked below 25 percentile.
- Q2 (25-50%): Transcripts with expression level ranked between 25 percentile and 50 percentile.
- Q3 (50-75%): Transcripts with expression level ranked between 50 percentile and 75 percentile.
- Q4 (75-100%): Transcripts with expression level ranked above 75 percentile.
BAM/SAM file containing more than 100 million alignments will make module very slow.
Follow example below to visualize a particular transcript (using R console):
pdf("xxx.pdf")     #starts the graphics device driver for producing PDF graphics
x <- seq(5,100,5)  #resampling percentage (5,10,15,...,100)
rpkm <- c(32.95,35.43,35.15,36.04,36.41,37.76,38.96,38.62,37.81,38.14,37.97,38.58,38.59,38.54,38.67, 38.67,38.87,38.68,  38.42,  38.23)  #Paste RPKM values calculated from each subsets
scatter.smooth(x,100*abs(rpkm-rpkm[length(rpkm)])/(rpkm[length(rpkm)]),type="p",ylab="Precent Relative Error",xlab="Resampling Percentage")
dev.off()          #close graphical device
About RSeQC
The RSeQC package provides a number of useful modules that can comprehensively evaluate high throughput sequence data especially RNA-seq data. "Basic modules" quickly inspect sequence quality, nucleotide composition bias, PCR bias and GC bias, while "RNA-seq specific modules" investigate sequencing saturation status of both splicing junction detection and expression estimation, mapped reads clipping profile, mapped reads distribution, coverage uniformity over gene body, reproducibility, strand specificity and splice junction annotation.
The RSeQC package is licensed under the GNU GPL v3 license.